If you follow the social media postings of various anti-vaccination groups, you’ve probably seen them point to contemporary outbreaks of disease, and say something along the lines of:
While the media seem to be pushing the line that the unvaccinated are responsible for bringing these diseases back, when you look at the numbers from [particular outbreak], in fact most of the cases of the disease were in people who received the vaccine! [link to a news article with said statistic] Clearly this vaccine isn’t working if the vaccinated make up most of the notifications.
So, is this a valid point? On what basis are vaccines even considered to be effective, and how does that determination hold up against data from actual outbreaks in which the immunised can represent the majority of cases? Vaccines are evaluated for effectiveness in preventing disease in much the same way as any other intervention on a disease outcome. Groups of people either given the vaccine or not are followed, and researchers record whether or not they catch the disease in question. This data is used to calculate ‘Relative Risk’ and ‘Vaccine Efficacy’ values as a way of quantifying the effects of the intervention on the disease. Relative risk (also known as ‘risk ratio’ or RR) is the more intuitive of the two measures, and is calculated relatively simply. As an example, imagine an office block of workers, containing 600 non-smokers and 150 smokers, and after ten years thirty of the people have lung cancer: 15 smokers and 15 non-smokers. Although an equal number of people from each group came down with lung cancer, 15/600 non-smokers or 2.5% of that group got the disease, compared to 15/150 or 10% of the smokers. To calculate the relative risk of lung cancer to the smoking group we simply divide their risk of disease (10%) by that of the non-smoking group (2.5%) which gives us a Relative Risk of 10/2.5= 4, or to put it another way, the smoking group had four times the risk of lung cancer of the non-smoking group. I’ve illustrated this example below, which might be easier to visualise: 
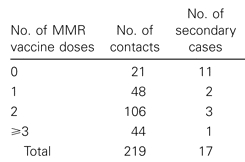
![]() Risk ratios can also be calculated in studies of vaccine effectiveness. Take this report of a Measles virus outbreak on the island of Majuro. Researchers identified measles cases in seventy two households and then collected evidence of MMR (measles, mumps and rubella combination vaccine) receipt by their household contacts. In the following weeks, researchers recorded which household contacts developed measles, listed below grouped by vaccination status.
Risk ratios can also be calculated in studies of vaccine effectiveness. Take this report of a Measles virus outbreak on the island of Majuro. Researchers identified measles cases in seventy two households and then collected evidence of MMR (measles, mumps and rubella combination vaccine) receipt by their household contacts. In the following weeks, researchers recorded which household contacts developed measles, listed below grouped by vaccination status.

Researchers followed people diagnosed with measles (primary cases) and recorded the number of household contacts they had. The number of those household contacts to come down with the disease (secondary cases) is listed here by number of doses of Measles, Mumps and Rubella (MMR) combined vaccine received. Source.
As you can see, 11 of the 21 MMR-unvaccinated household contacts, or 52%, caught measles. This compares to 2/48 or 4.2% of MMR single dose recipients and 3/106 = 2.8% of two dose recipients who caught measles. If you’d like to have a go at using these absolute risk values to calculate the relative risk of catching measles of the MMR unvaccinated compared to either one- or two-dose recipients, I’ll wait. If you calculated that, in this outbreak, the MMR-unvaccinated had 12.4 times the rate of measles as single dose recipients, and 18.6 times that of the two-dose recipients, nice work. So, in short, relative risk is a commonly used measure for presenting the increased or decreased risk of disease in one group of people compared to another. While relative risk is a relatively intuitive way of describing the effects of a vaccine on the chances of contracting disease, in the scientific literature the effect of vaccines on the risk of disease is usually presented on a zero to one hundred percent scale called ‘Vaccine Efficacy’ (VE). The VE is calculated using the same data (rate of disease in the vaccinated and non-vaccinated groups), but expresses it as how much disease seen in the unvaccinated group was prevented in the vaccinated group. So say you had two equally sized vaccinated and unvaccinated groups of people. If there were 100 cases of disease in the unvaccinated and 25 cases of disease in the vaccinated, the vaccine efficacy would be 75%, to describe the 75 of a potential 1oo cases prevented by the vaccine. We can calculate VE values for the MMR vaccine against measles using the data from the paper discussed earlier. 52% of the unvaccinated caught measles, compared to 4.2% of people who received a single dose of the MMR. Therefore the rate of disease in single dose recipients was 4.2/52 or 8% of that in the unvaccinated. Because 92% of measles incidence seen in the MMR unvaccinated was prevented in the single dose recipients (100 – 8 = 92), the VE for one dose of MMR against measles was 92%. Similarly, only 2.8% of two dose recipients caught measles, 2.8/52 or 5% the rate of disease in MMR non-recipients. This equates to a VE of 95% for two doses of the MMR. On the VE scale, if the rate of disease is the same between vaccinated and non-vaccinated groups – that is, the vaccine had no effect – then the vaccine has a VE of 0%. In contrast, if no vaccinated catch the disease, it would have a VE of 100%, indicating complete protection. In short, vaccine efficacy conveys what percentage of disease seen in the unvaccinated group was prevented in the vaccinated group. Depending on which you prefer, you can convert between Vaccine Efficacy and Relative Risk using a simple formula, but since no one has time for calculator button mashing in this day and age, here’s a simple calculator I put together to give you the corresponding relative risk for any vaccine efficacy value you enter:
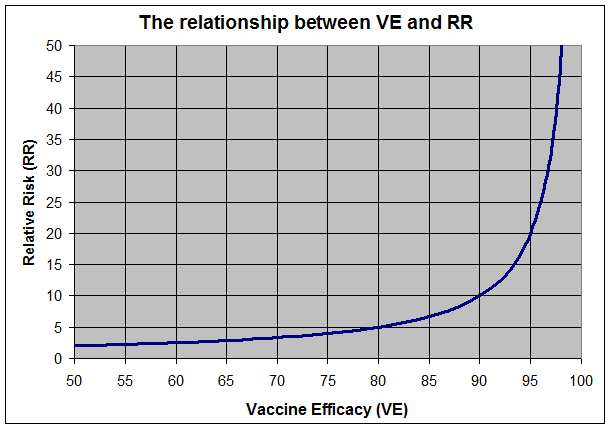
Or, for those of you who are more visual, here’s a graph of which RR values correspond with which vaccine efficacy values.

How Relative Risk values convert to Vaccine Efficacy values. Keep in mind that Relative Risk can vary from 1.0 (no difference in disease rate between groups) to infinity (disease in the unimmunised but complete protection of the immunised), so conversion to the 0-100 Vaccine Efficacy scale requires a steep curve as VE approaches 100%
So imagine a vaccine with a Vaccine Efficacy value of 50% – which corresponds to RR=2, or the unvaccinated having twice the rate of disease of the vaccinated. If you study two equally sized groups of people that did and did not receive said vaccine, in an outbreak you’d expect the unvaccinated to have twice as many cases of the disease. But if the unvaccinated group was twice as big as the vaccinated, you would expect to see equal numbers of cases in both groups, and similarly you would expect to see more cases in the vaccinated if they outnumbered the unvaccinated by more than two to one. So although the vaccinated are at a reduced risk of catching the disease, if they outnumber the unvaccinated by more than the risk ratio for that vaccine, we should actually expect to see more cases of the disease, by number, in the vaccinated, despite a lower risk per person. If you’d like to play around with how the maths works, below is a simple calculator into which you can put a vaccine efficacy value and a vaccination rate for a hypothetical disease, and it will tell you how many cases you’d expect to see in the vaccinated for each case in the unvaccinated, assuming equal exposure to disease between the immunised and unimmunised groups. Have a play around and see if you can change the parameters to get more cases in the vaccinated group than the unvaccinated group. If you’d try it with some real VE values, on the high end of the scale one dose of MMR vaccine has a VE of at least 95% against measles, and on the low end of the scale the CDC’s mid-season estimate of the influenza vaccine for the 2013-2014 ‘flu season was 61%.
In summary, vaccines reduce the risk of contracting diseases, they do not eliminate this risk entirely. Even though the unimmunised may be at a considerably higher risk of contracting a disease, because they make up such a small sliver of the population, we should not be surprised to see them representing the minority of cases during outbreaks of vaccine-preventable diseases. As explained above, this is not a challenge to the effectiveness of vaccines, but instead is to be expected in populations where the vaccinated outnumber the unvaccinated.
